
This article is part of a series on the scalability in a hybrid cloud with Azure :
Introduction
The first two articles in the hybrid cloud series allowed us to first set up the infrastructure combining the private network and the Azure public cloud, then to implement the application scalability mechanism based on an Azure function.
Now it remains to establish the automatic triggering of VM creations/deletions on the cloud based on monitoring events. This is what we will address here by configuring a Grafana / Prometheus / Alertmanager monitoring stack.
Use cases
Let’s recall the local VM monitoring rules that we set for ourselves to determine the creation or deletion of VMs on the Azure cloud:
- CPU > 70% over the last 5 minutes => creation of Azure VM (up to two maximum)
- CPU < 30% over the last hour with presence of at least one peak > 70% (in 5 minute steps) => deletion of Azure VM
On the other hand, we recall the scalability mechanism put in place which links these monitoring alerts to the VM creation/deletion actions on Azure.
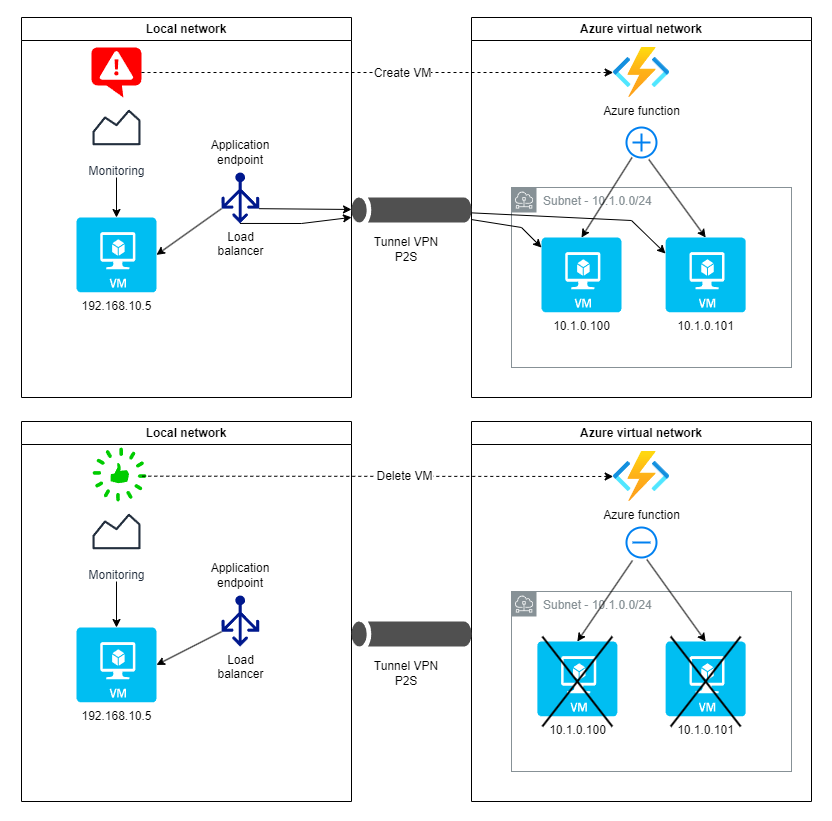
So we will look at how to generate monitoring events and make them interact with Azure Functions to ensure the scalability of our application.
Installation of local monitoring
As mentioned, we will choose to install a Grafana / Prometheus / Alertmanager stack for monitoring management (Prometheus), alert definition (Alertmanager) and graphical display of data (Grafana). The system metrics of the server where the application runs are provided by Node exporter which communicates directly with Prometheus for their processing.
Harvesting metrics with Node exporter
Our first goal is to monitor the system resources (CPU, RAM, storage, network, …) of the local network server on which our application runs.
Node exporter is an open source tool, primarily used in system monitoring environments, to collect and expose system metrics on Linux servers. It is specifically designed to be used with Prometheus, a monitoring and alerting solution.
In a very simple way, Node exporter can be deployed using Docker Compose and communicate the collected data on port 9100 (by default). We will notice that in our case, we constitute a common docker-compose.yml file with the application running on the server that we wish to monitor.
Since we are using a containerized Node exporter installation, we need to carefully define the volumes with sufficient rights on the host to monitor the server metrics and not the container itself.
services:
  # Server Web Application
  application:
    image: crccheck/hello-world
    container_name: application
    ports:
      - "80:8000"

  # Service Node Exporter
  node-exporter:
    image: prom/node-exporter:v1.8.1
    container_name: node_exporter
    # We expose port 9100 which will be accessible for Prometheus
    # deployed on another server dedicated to monitoring
    ports:
      - "9100:9100"
    volumes:
      # The following volumes define the system directories
      # from the server where the metrics will be collected
      - /proc:/host/proc:ro
      - /sys:/host/sys:ro
      - /:/rootfs:ro
      # This volume allows to correct a possible launch error
      - /srv/app/node-exporter/textfile_collector:/var/lib/node_exporter/textfile_collector:ro
      # Here we associate the system date of the server and that of the container
      - /etc/localtime:/etc/localtime:ro
    command:
      # node-exporter launch parameters
      - '--path.procfs=/host/proc'
      - '--path.sysfs=/host/sys'
      - '--path.rootfs=/rootfs'
      - '--collector.textfile.directory=/var/lib/node_exporter/textfile_collector'
      - '--collector.filesystem.mount-points-exclude=^/(sys|proc|dev|host|etc)($$|/)'
    restart: always
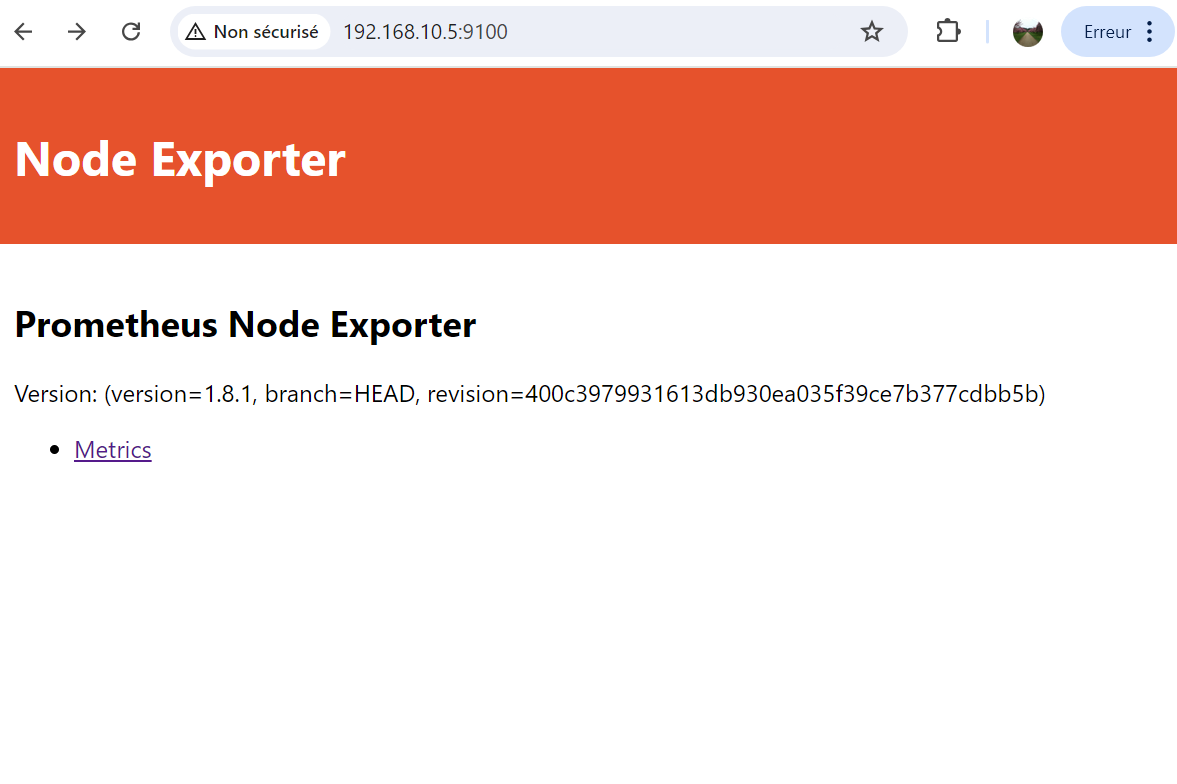
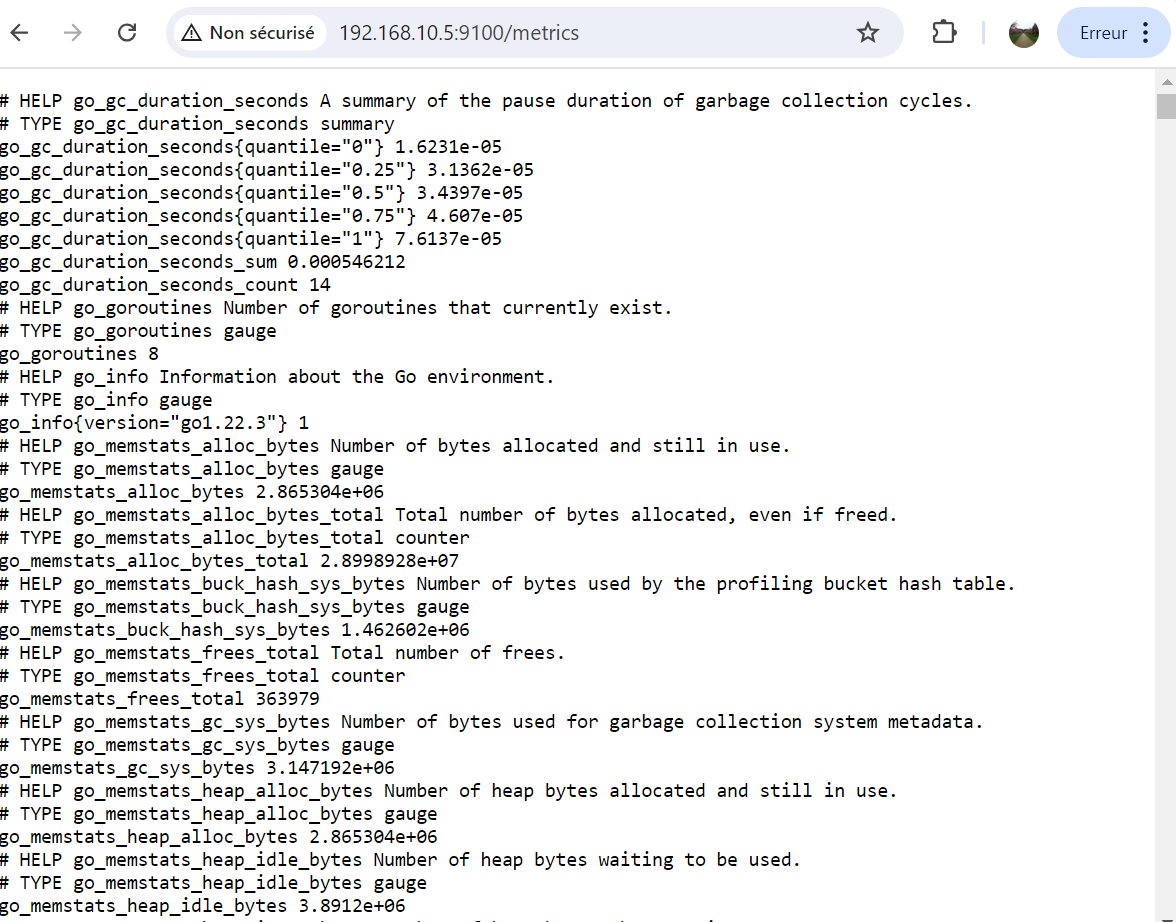
Once the environment is launched with the command docker compose up -d, we have access to a page on port 9100 of the server (here IP address 192.168.10.5).
Deploying Grafana / Prometheus / Alertmanager
The deployment of services performing the analysis (dashboard, definition of alerts) of the system data sent back by Node exporter is also done with Docker Compose on another server dedicated to monitoring.
services:
  grafana:
    image: grafana/grafana:10.4.4
    container_name: grafana
    ports:
      - "3000:3000"
    networks:
      - monitoring
    volumes:
      - grafana-data:/var/lib/grafana
      - /etc/localtime:/etc/localtime:ro
      # - /home/guaz/certs/perso/perso.com.key:/etc/grafana/grafana.key:ro
      # - /home/guaz/certs/perso/perso.com.crt:/etc/grafana/grafana.crt:ro
    environment:
      # Setting admin account credentials
      GF_SECURITY_ADMIN_USER: admin
      GF_SECURITY_ADMIN_PASSWORD: NV1lgz7ViL4xibQ8NtqV
      # Setting Grafana server URL
      # GF_SERVER_DOMAIN: "grafana.perso.com"
      # GF_SERVER_ROOT_URL: "https://grafana.perso.com/"
    restart: always

  prometheus:
    image: prom/prometheus:v2.53.0
    container_name: prometheus
    ports:
      - "9090:9090"
    networks:
      - monitoring
    volumes:
      - ./prometheus/prometheus.yml:/etc/prometheus/prometheus.yml
      - ./prometheus/alert.rules.yml:/etc/prometheus/alert.rules.yml
      - prometheus-data:/prometheus
      - /etc/localtime:/etc/localtime:ro
    command:
      - '--config.file=/etc/prometheus/prometheus.yml'
      - '--storage.tsdb.path=/prometheus'
      - '--web.console.libraries=/etc/prometheus/console_libraries'
      - '--web.console.templates=/etc/prometheus/consoles'
      - '--web.enable-lifecycle'
    restart: always

  alertmanager:
    image: prom/alertmanager:v0.27.0
    container_name: alertmanager
    ports:
      - "9093:9093"
    networks:
      - monitoring
    volumes:
      - alertmanager-data:/data
      - ./alert-manager/alertmanager.yml:/config/alertmanager.yml
      - /etc/localtime:/etc/localtime:ro
    command: --config.file=/config/alertmanager.yml --log.level=debug

volumes:
  grafana-data:
  prometheus-data:
  alertmanager-data:

networks:
  monitoring:
    driver: 'bridge'
Some notes on the installation:
- The ports exposed for each of the services are:
3000for Grafana,9090for Prometheus and9093for Alertmanager. We have chosen to open them directly to the outside to have access to their respective interfaces. This is not necessary for them to communicate with each other since they belong to the same Docker networkmonitoring. - Each service needs a volume to store data:
grafana-data,prometheus-data,alertmanager-data. - Grafana configuration is managed by environment variables while Prometheus and Alertmanager require creating bind mount volumes for their configuration files.
- The
/etc/localtimemounting volume has no other purpose than to ensure that containers and the host share the same system time. - The Prometheus launch command parameters ensure the following:
--config.file: specification of the configuration file in a volume allowing its modification from the outside--storage.tsdb.path: The data storage path is correctly assigned to the persistent volume.-web.enable-lifecycle: This option allows to reload the configuration without restarting the container, which is useful for applying dynamic changes.
Implementing alerting
Configuration of Prometheus
We have seen previously that the Prometheus configuration consists of two files: /etc/prometheus/prometheus.yml and /etc/prometheus/alert.rules.yml
(i.e. ./prometheus/prometheus.yml and ./prometheus/alert.rules.yml on the monitoring server where Docker Compose is located).
prometheus.yml
global:
  scrape_interval: 1m

rule_files:
  - /etc/prometheus/alert.rules.yml

alerting:
  alertmanagers:
    - scheme: http
    - static_configs:
        - targets: ['alertmanager:9093']

scrape_configs:
  - job_name: 'node'
    static_configs:
      - targets: ['vm-debian-3:9100']
The general Prometheus configuration defines the following:
scrape_interval: the interval for retrieving metrics (here, one minute)rule_files: the file containing the alert rulesalerting: the part defining the sending of alerts, here to thealertmanagerservice accessible on port 9093scrape_configs: the configuration of the servers to monitor. Here, we only have the VM of our application namedvm-debian-3on which Node exporter is accessible by port 9100
alert.rules.yml
groups:
  - name: cpu_alerts
    rules:
      - alert: HighCPUUsage
        expr: (1 - rate(node_cpu_seconds_total{instance="vm-debian-3:9100", mode="idle"}[5m])) * 100 > 70
        for: 5m
        labels:
          severity: critical
        annotations:
          summary: "High CPU usage detected on instance {{ $labels.instance }}"
          description: "The CPU usage on instance {{ $labels.instance }} has been over 70% for more than 5 minutes."
      - alert: NormalCPUUsage
        expr: |
          max_over_time((1 - rate(node_cpu_seconds_total{instance="vm-debian-3:9100",mode="idle"}[5m]))[1h:5m]) * 100 > 70
          and (1 - rate(node_cpu_seconds_total{instance="vm-debian-3:9100", mode="idle"}[1h])) * 100 < 30
        for: 1h
        labels:
          severity: none
        annotations:
          summary: "CPU back to normal usage on instance {{ $labels.instance }}"
          description: "The CPU usage on instance {{ $labels.instance }} has come down under 30% after a peak."
This file therefore contains the definition of CPU usage alerts as previously defined:
- CPU > 70% over the last 5 minutes
- CPU < 30% over the last hour with presence of at least one peak > 70% (in 5 minute steps)
These alerts are defined under the expr parameter by PromQL expressions.
The next configuration parameter, for, defines a wait time for which the alert must remain active before it is sent. Without this clause, alerts
would be sent immediately upon receipt.
Finally, we indicate the severity of the alert in the labels, and the annotations add an explicit definition of the alerts.
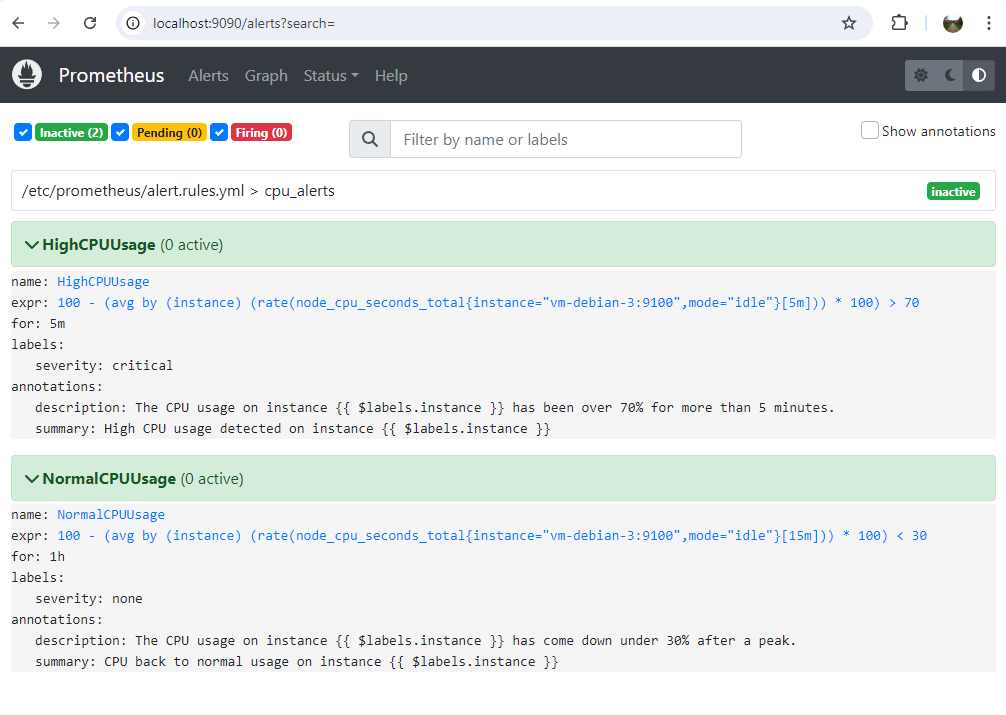
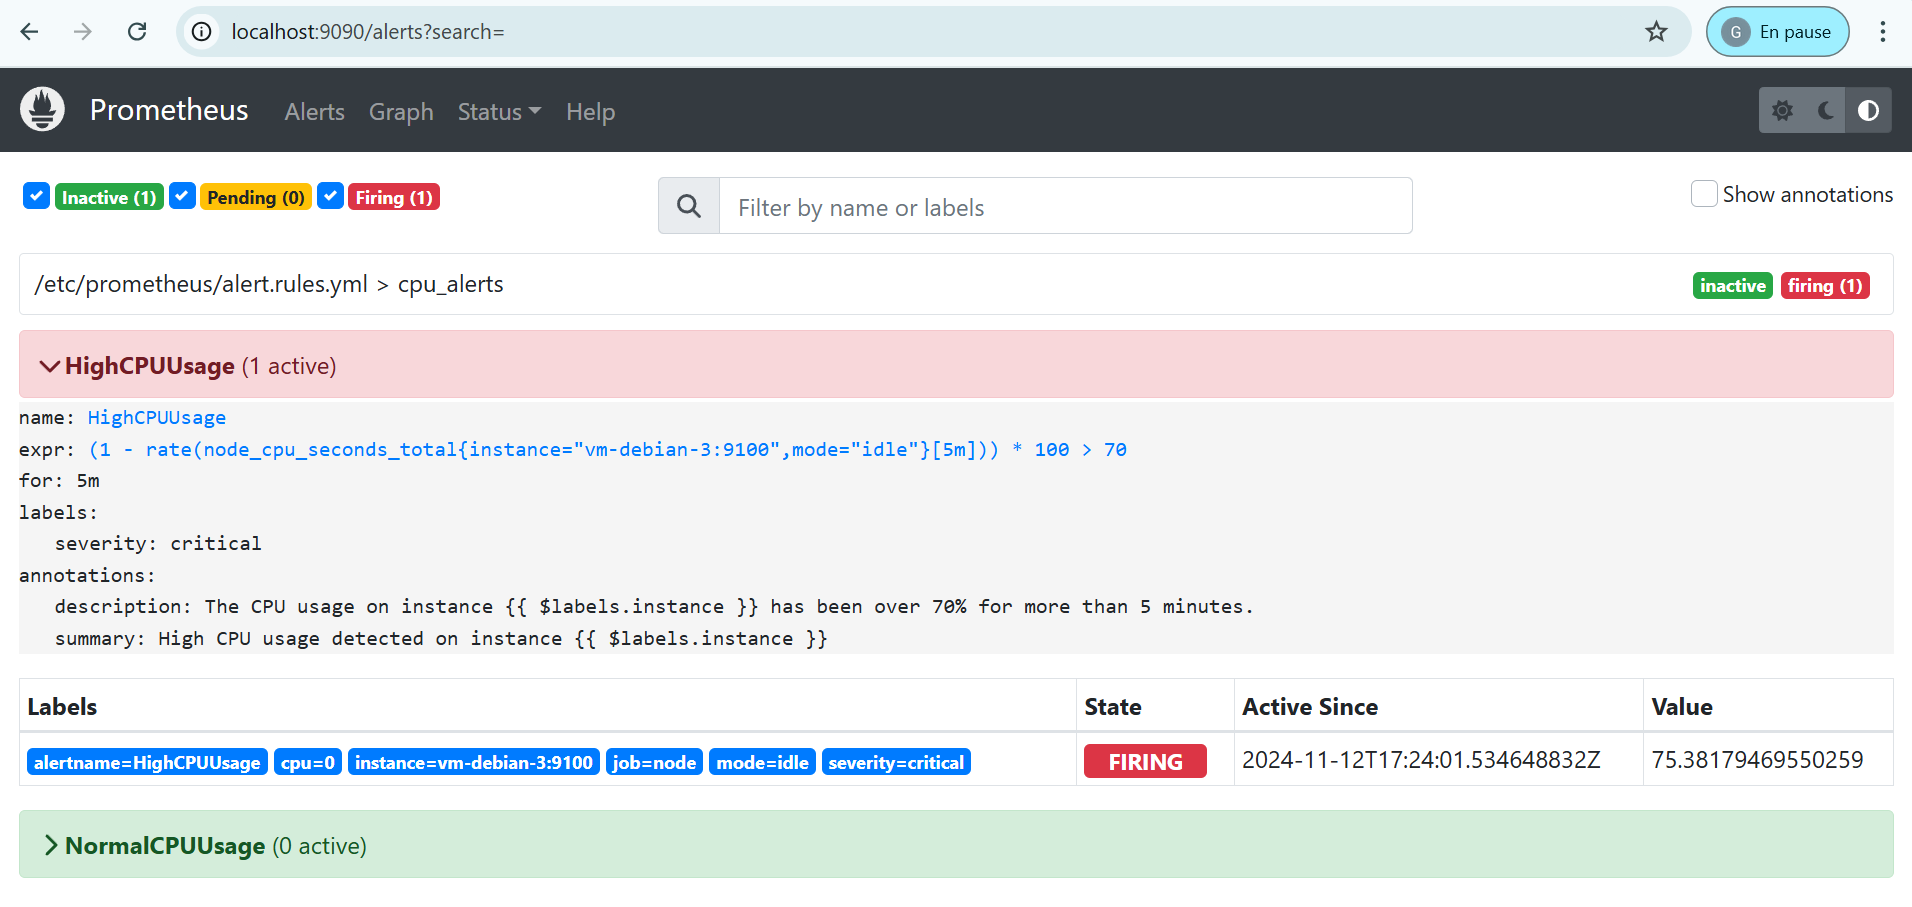
On the Prometheus interface (available in our case at the URL http://localhost:9090) we can see these alerts and their status.
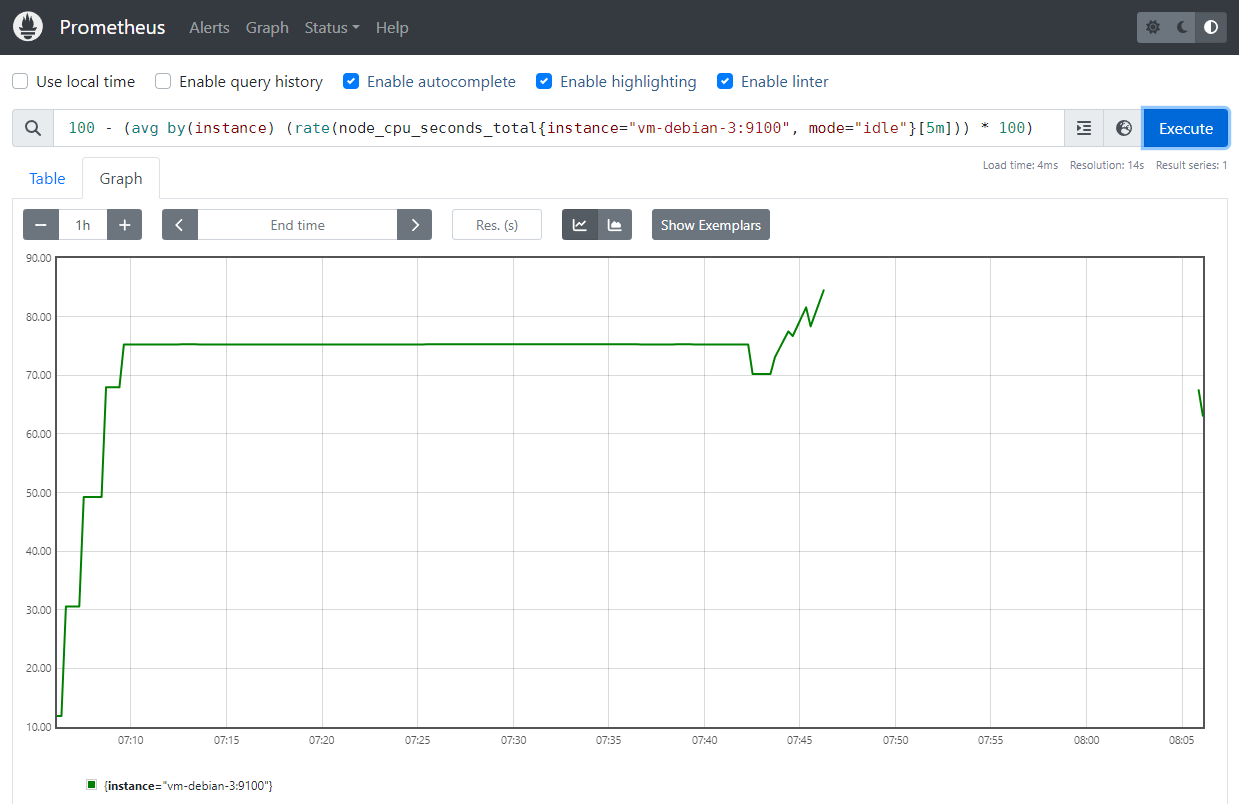
In the Graph part, it is possible to visualize metrics by indicating PromQL expressions.
Alert definition details
The PromQL expressions defining monitoring alerts are quite complex at first glance. We will explain some elements of them here.
HighCPUUsageexpr: (1 - rate(node_cpu_seconds_total{instance="vm-debian-3:9100", mode="idle"}[5m])) * 100rate(node_cpu_seconds_total{instance="vm-debian-3:9100", mode="idle"}[5m]: the rate function calculates the average idle rate of the CPU of the VM that we wish to monitor over the last 5 minutes elapsed.(1 - ...) * 100: we get the CPU usage rate by subtracting the previous result from 1, then multiplying it by 100 to get a percentage> 70: checks that this CPU usage rate exceeds the 70% threshold in order to trigger the alert
NormalCPUUsageexpr: | (max_over_time((1 - rate(node_cpu_seconds_total{instance="vm-debian-3:9100",mode="idle"}[5m]))[1h:5m]) * 100) > 70) and ((1 - rate(node_cpu_seconds_total{instance="vm-debian-3:9100", mode="idle"}[1h])) * 100) < 30)Here, the expression is divided into two parts:
- Detection of a usage peak CPU greater than 70% in the last hour
1 - rate(...)[5m]: as before, we get the average CPU usage rate per 5 minute periodmax_over_time((...[1h:5m]): this function captures the maximum CPU activity peak observed over the last hour with 5 minute measurement intervals ([1h:5m])* 100) > 70: we ensure that this peak activity was greater than 70%
- Check that the average CPU usage has fallen below 30% over the last hour: this is the same
expression as for the
HighCPUUsagealert but with the< 30test.
- Detection of a usage peak CPU greater than 70% in the last hour
For a monitored infrastructure made of several servers, we precede the calculation of the resource utilization rate by PromQL by
avg by(instance)to get the average per instance:avg by(instance)(rate(node_cpu_seconds_total{instance=~"server1|server2|server3", mode="idle"}[5m]))
This way, the NormalCPUUsage alert is triggered when we ensure that resource usage has returned to normal.
of the local VM on which our application is deployed, and causes the deletion of VMs created on the cloud using Alertmanager.
We will now describe how to configure Alertmanager to associate the desired tasks when monitoring alerts are triggered.
Managing alerts with Alertmanager
We have seen that Prometheus has the ability to retrieve system metrics and generate alerts from them.
Now, Alertmanager will allow you to exploit these alerts by associating a task with them. In our case, we want to create/delete VMs on the Azure cloud in order to implement our hybrid cloud strategy. This will be done by API calls to the Azure function that we detailed in the article dedicated to it.
Now let’s look at the contents of the alertmanager.yml configuration file:
route:
  group_by: ['alertname']
  receiver: 'default'
  group_wait: 30s
  group_interval: 5m
  repeat_interval: 12h
  routes:
    - receiver: 'create-vm'
      matchers:
        - alertname = "HighCPUUsage"
    - receiver: 'delete-vm'
      matchers:
        - alertname = "NormalCPUUsage"

receivers:
  - name: 'default'
  - name: 'create-vm'
    webhook_configs:
    - url: https://tp-cloud-autoscale-vpn.azurewebsites.net/api/autoscale-vpn?action=create
  - name: 'delete-vm'
    webhook_configs:
    - url: https://tp-cloud-autoscale-vpn.azurewebsites.net/api/autoscale-vpn?action=delete
This file configures how alerts are processed and sent to specific destinations (receivers).
The route section defines how alerts are grouped, waited for, and forwarded to specific destinations called “receivers”.
group_by: ['alertname']: alerts are grouped by name (alertname).receiver: 'default': if an alert does not match any specific route, it is sent to the ‘default’ receiver.group_wait: 30s,group_interval: 5m,repeat_interval: 12h: define the delays for sending and repeating alerts.
Under the routes key, specific routes are defined for particular alert types, each directed to a different receiver.
create-vm: sends HighCPUUsage alerts to a webhook to create a VM.delete-vm: sends NormalCPUUsage alerts to a webhook to delete a VM.
Finally, the receivers section defines the webhook URLs corresponding to each of the routes.
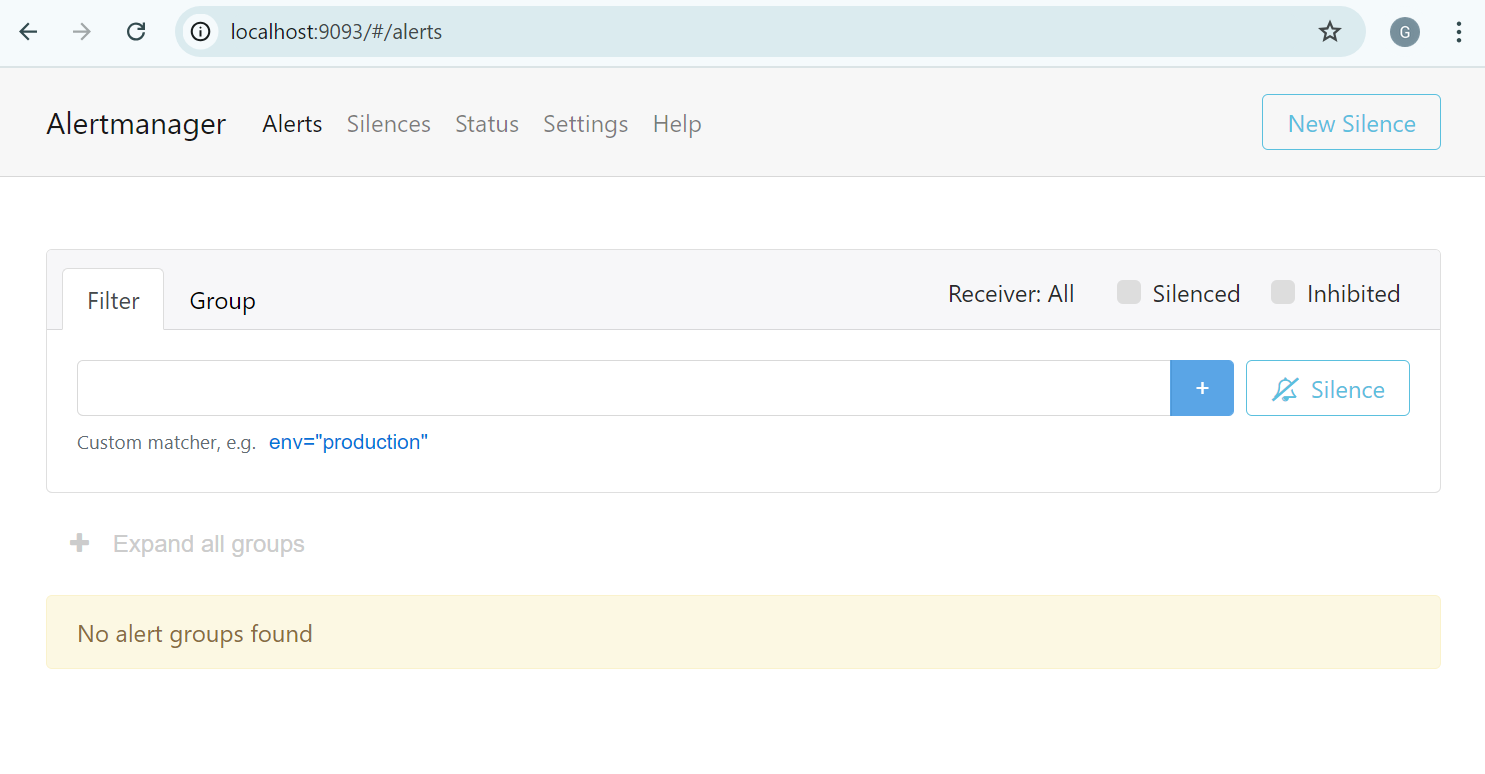
Alertmanager also offers a web page available on port 9093 of the monitoring server.
Testing scaling on monitoring alerts
CPU load simulation on local server
We will install the stress-ng tool which allows, on Linux systems, to submit at a given load the target server.
On a Debian distribution, this is done very simply with the following command:
sudo apt-get install stress-ng
In order to trigger the previously defined HighCPUUsage monitoring alert, we will run the command below which will increase the CPU usage to 75% for a single processor (which is sufficient since our application’s local server is a 1 vCPU VM).
$ stress-ng -c 1 -l 75
stress-ng: info:  [948] defaulting to a 86400 second (1 day, 0.00 secs) run per stressor
stress-ng: info:  [948] dispatching hogs: 1 cpu
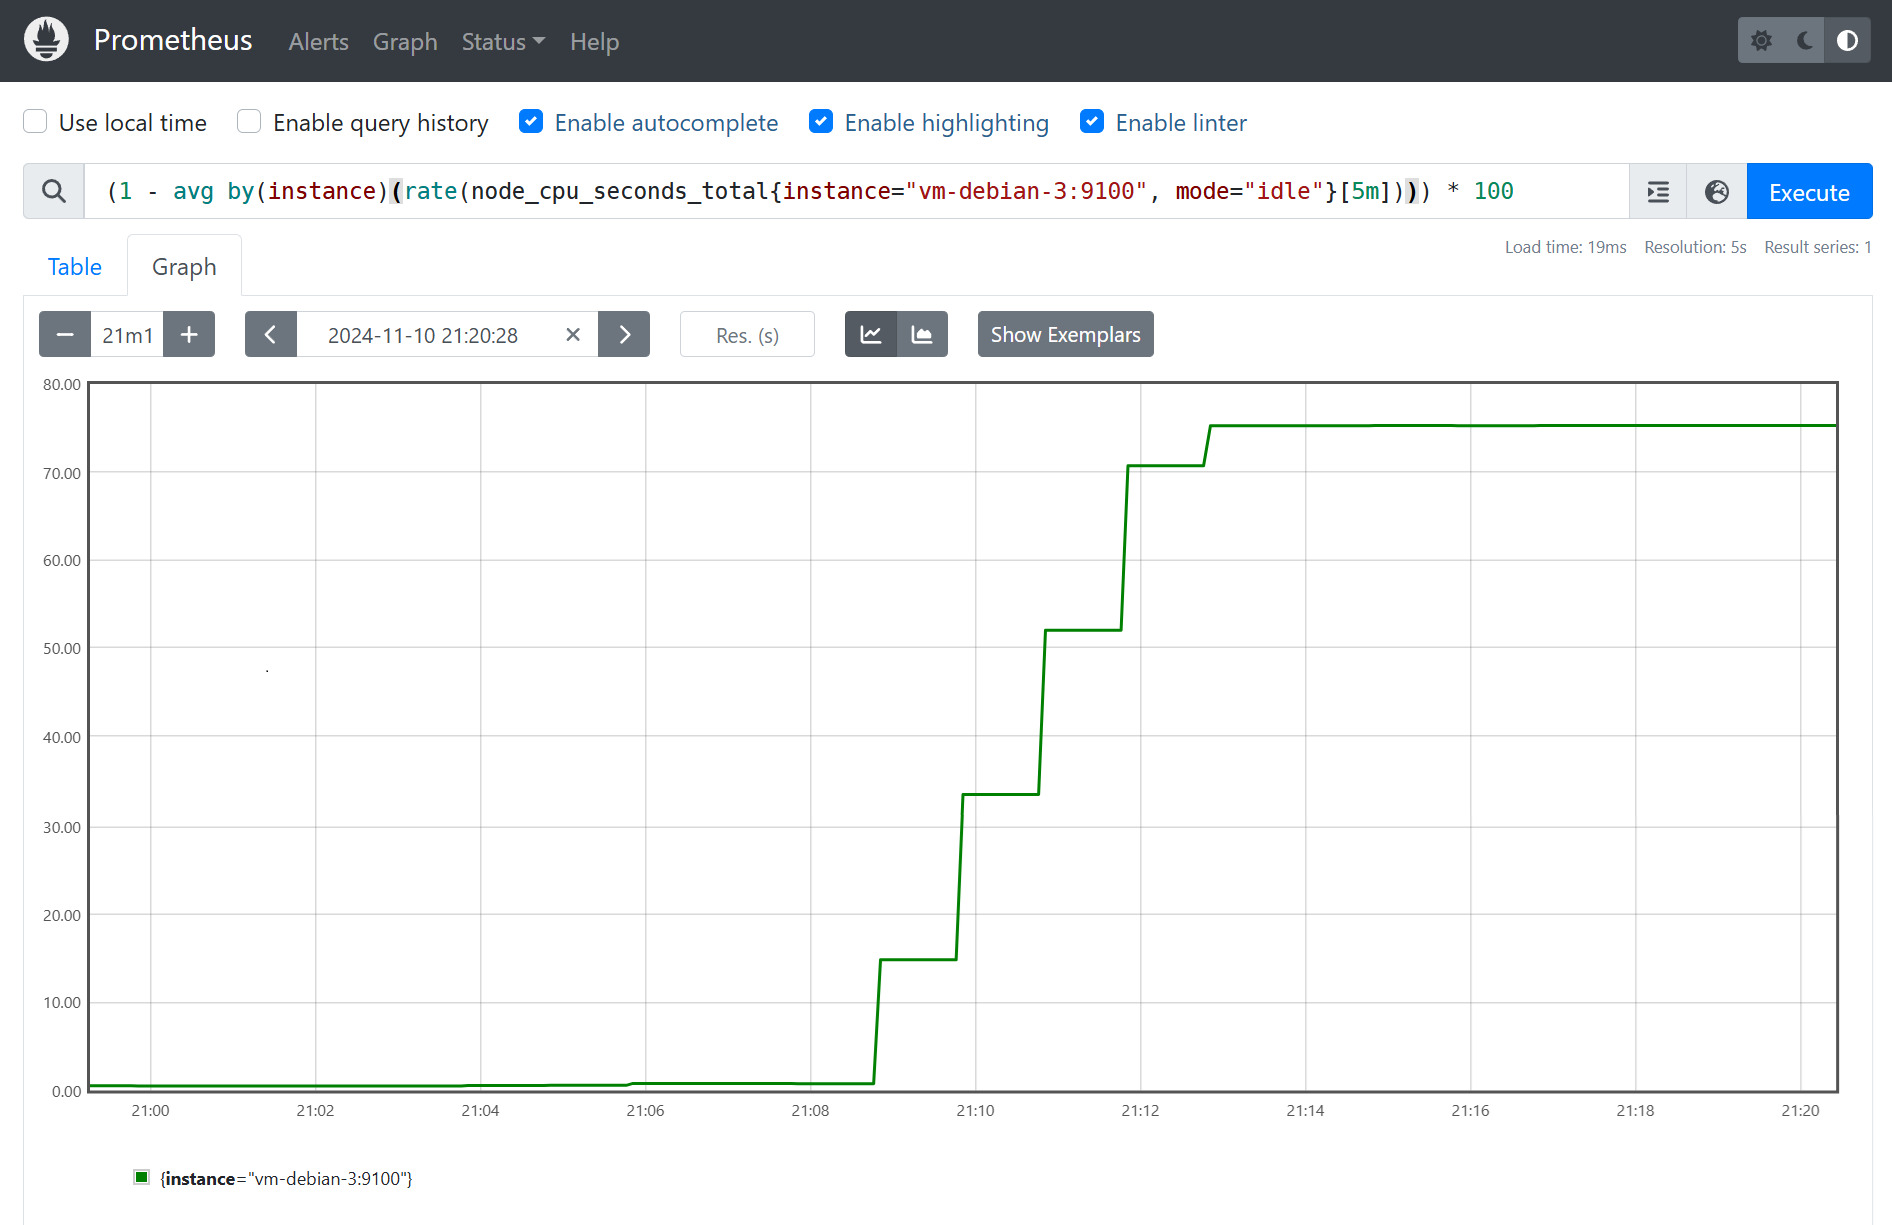
Logically, we can see in Prometheus the CPU usage averaged in 5 minute steps quickly going above the 70% threshold that is supposed to trigger the HighCPUUsage alert.
Then, the alert is indeed emitted on the Prometheus interface, and initially in Pending state for the duration defined for the for parameter of the Prometheus configuration.
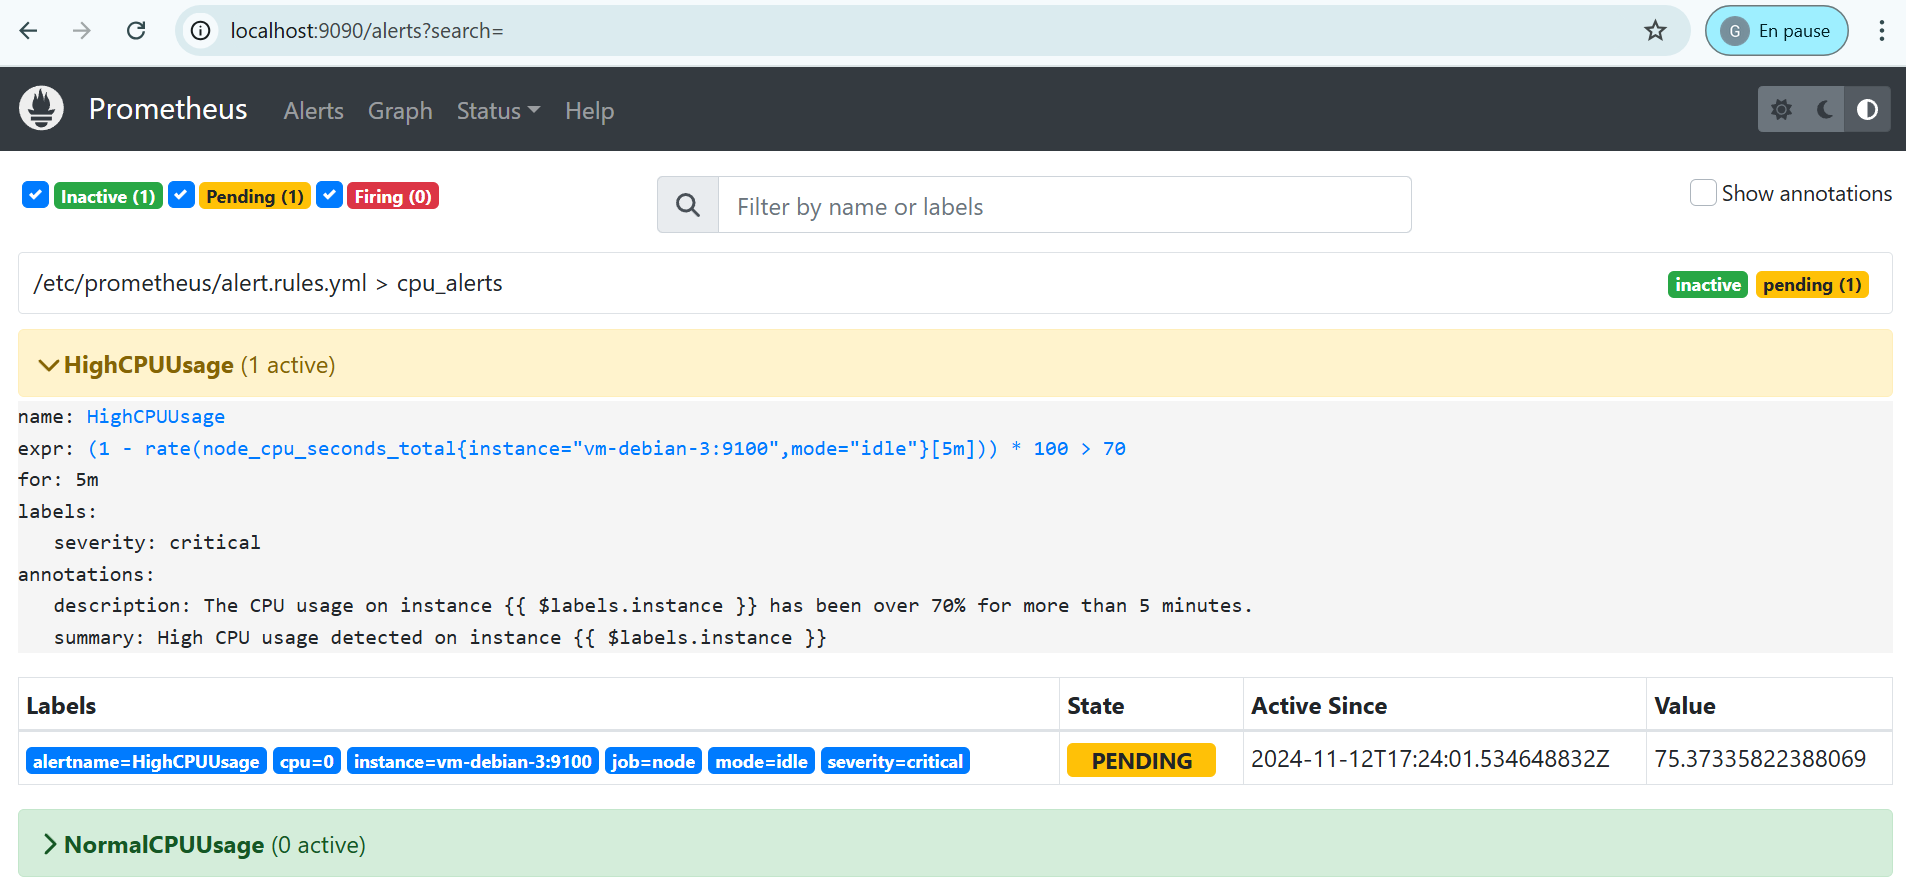
In our case, we must therefore wait 5 minutes before the alert goes into Firing status, meaning it has been sent to Alertmanager.
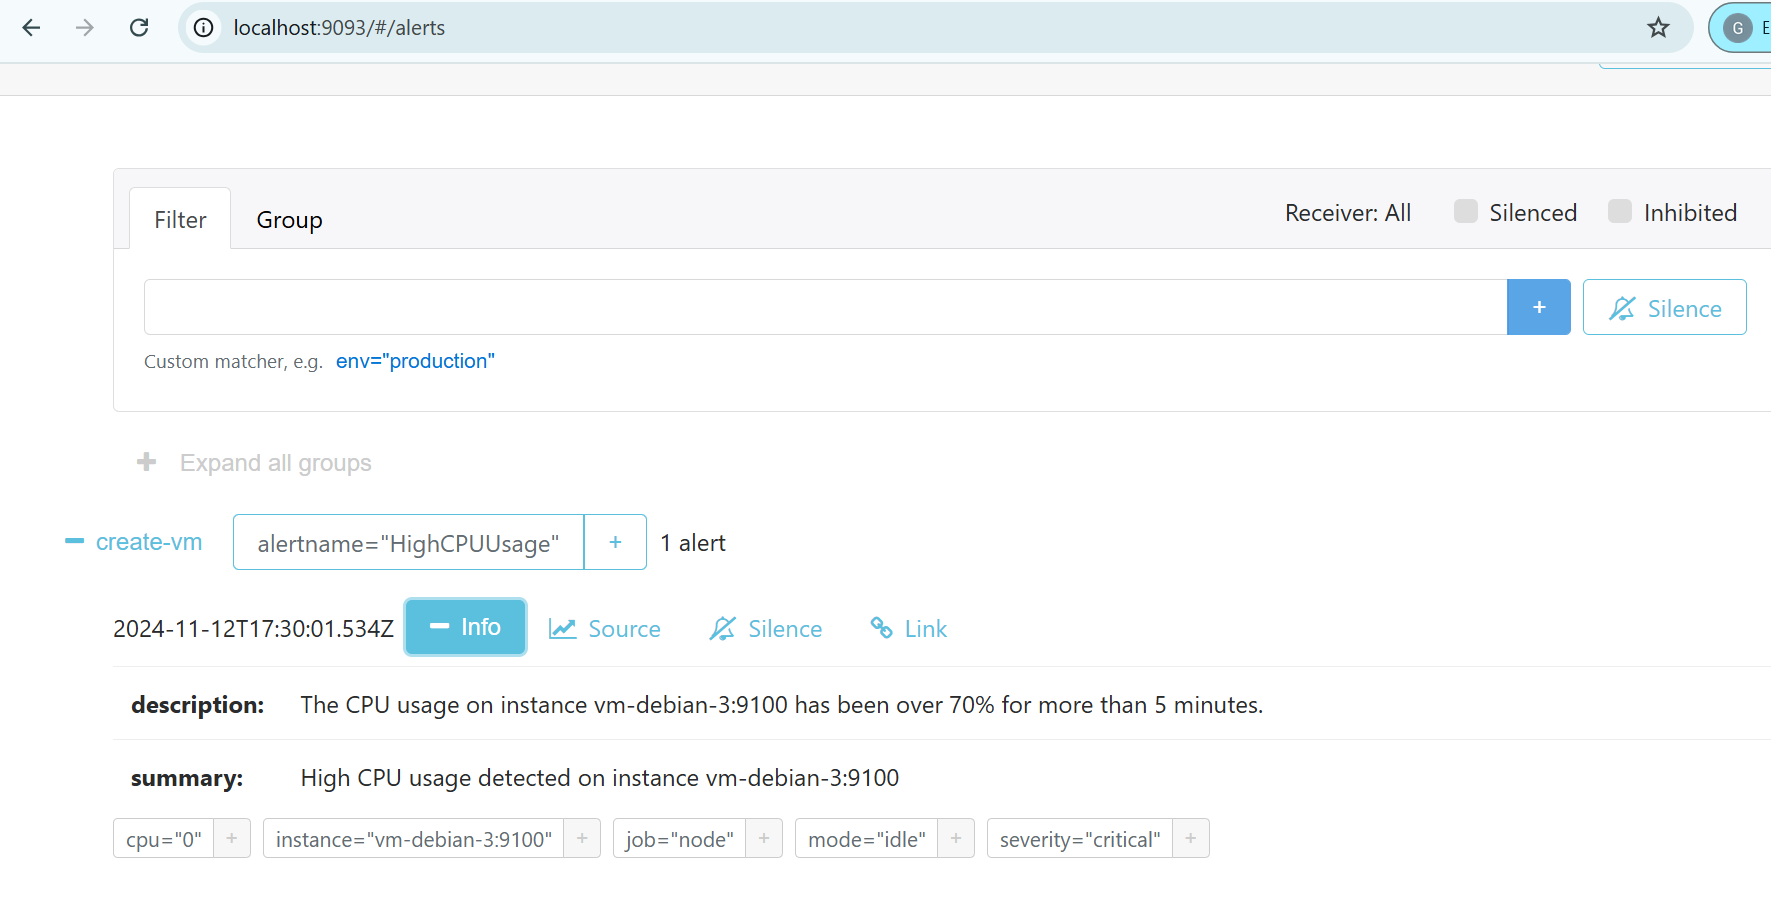
The Alertmanager interface allows us to see that the HighCPUUsage alert has been received.
Now let’s look at the logs of the Alertmanager container and we see that the reception of the HighCPUUsage alert sent by Prometheus which triggers
the call to the Azure Functions API (receiver=create-vm) to create a VM on the Azure cloud (here after an initial failure).
2024-07-18 09:02:46 ts=2024-07-18T07:02:46.332Z caller=dispatch.go:164 level=debug component=dispatcher msg="Received alert" alert=HighCPUUsage[b709916][active]
2024-07-18 09:02:46 ts=2024-07-18T07:02:46.334Z caller=dispatch.go:516 level=debug component=dispatcher aggrGroup="{}/{alertname=\"HighCPUUsage\"}:{alertname=\"HighCPUUsage\"}" msg=flushing alerts=[HighCPUUsage[b709916][active]]
2024-07-18 09:02:54 ts=2024-07-18T07:02:54.347Z caller=notify.go:848 level=warn component=dispatcher receiver=create-vm integration=webhook[0] aggrGroup="{}/{alertname=\"HighCPUUsage\"}:{alertname=\"HighCPUUsage\"}" msg="Notify attempt failed, will retry later" attempts=1 err="Post \"<redacted>\": dial tcp: lookup tp-cloud-autoscale-vpn.azurewebsites.net on 127.0.0.11:53: server misbehaving"
2024-07-18 09:04:46 ts=2024-07-18T07:04:46.308Z caller=dispatch.go:164 level=debug component=dispatcher msg="Received alert" alert=HighCPUUsage[b709916][active]
2024-07-18 09:05:45 ts=2024-07-18T07:05:45.824Z caller=notify.go:860 level=info component=dispatcher receiver=create-vm integration=webhook[0] aggrGroup="{}/{alertname=\"HighCPUUsage\"}:{alertname=\"HighCPUUsage\"}" msg="Notify success" attempts=2 duration=2m51.482925757s
Return to normal CPU load and delete the VM
Now we interrupt the CPU load test launched by the stress-ng command on our application’s local server.
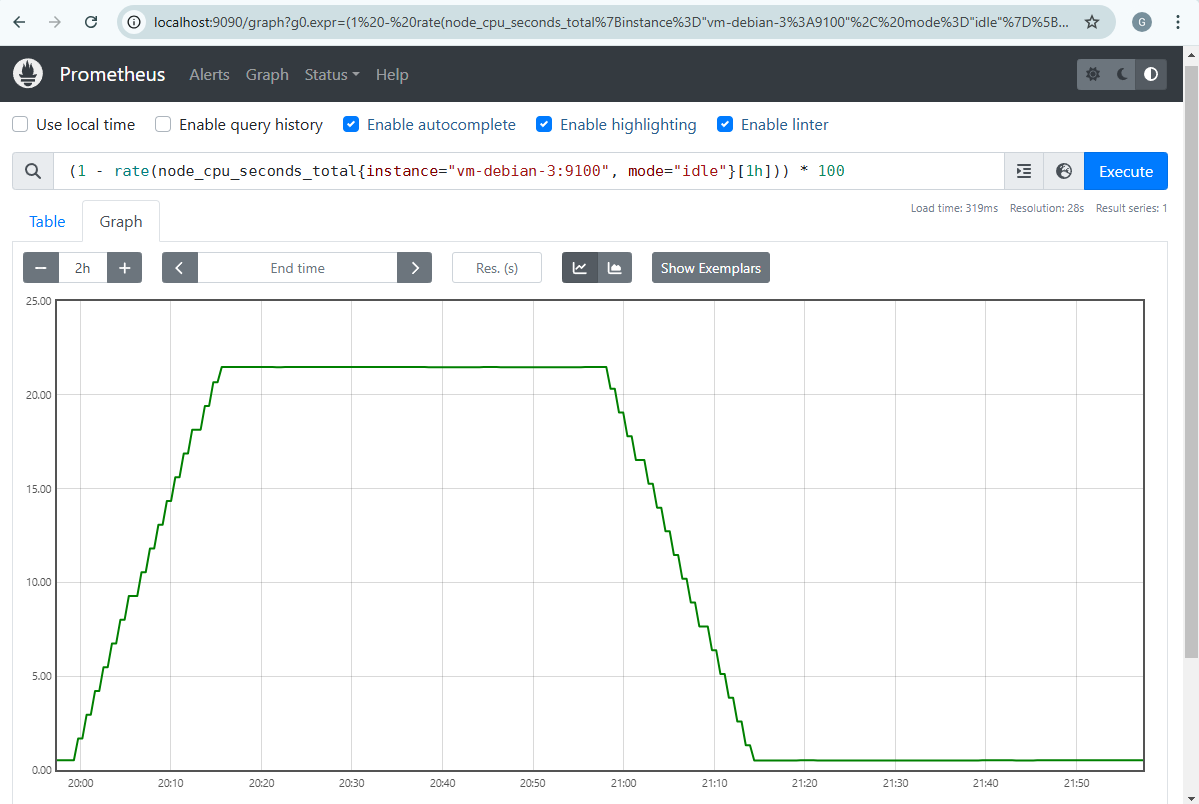
We can see on Prometheus that the hourly CPU average never exceeded 30% even during the peak activity generated.
Additionally, we see that the peak is well captured over the last hour elapsed during a given period.
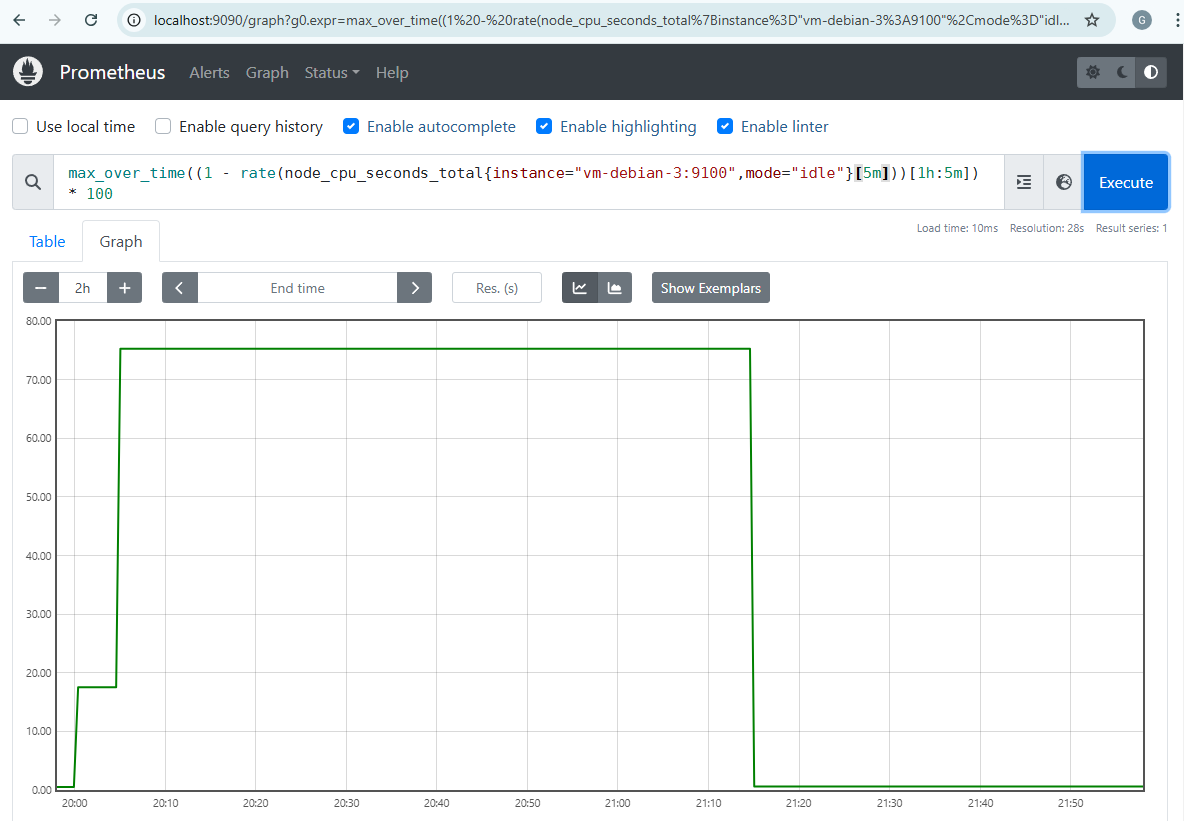
We are indeed in the conditions where the return to normal NormalCPUUsage alert can be generated, which we can first see on Prometheus.
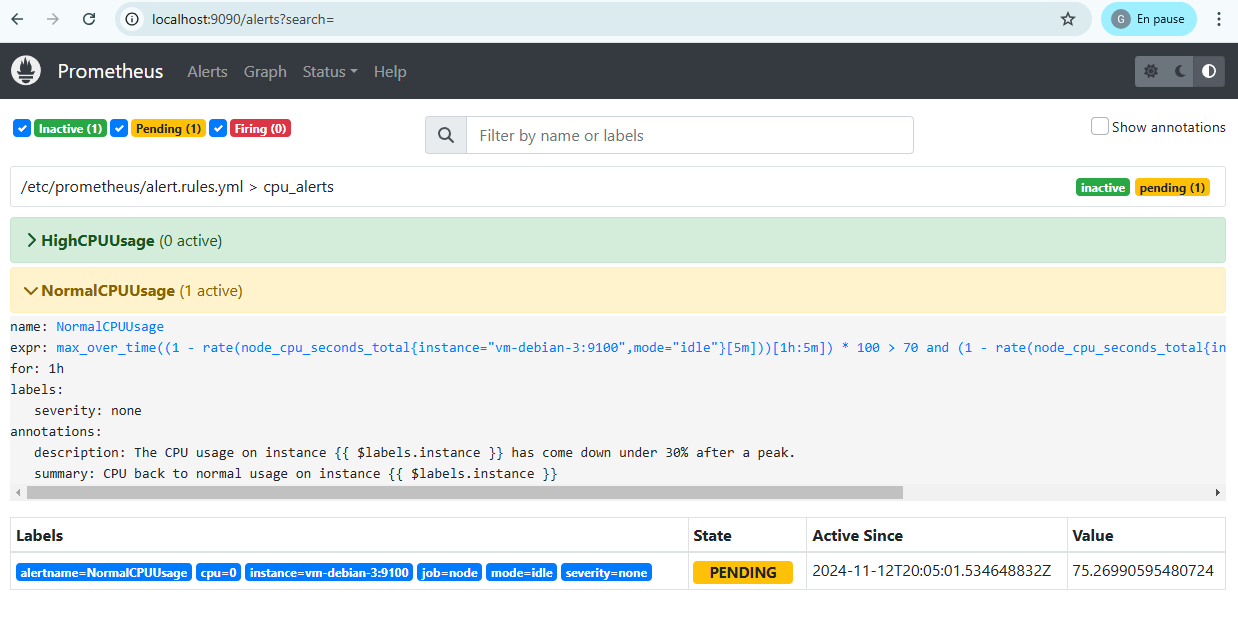
Due to the Prometheus configuration for parameter set to 1h, this time you have to wait an hour before the alert is actually launched. This delay was chosen so as not to overreact to CPU variations and allow a smoother transition between the different states.
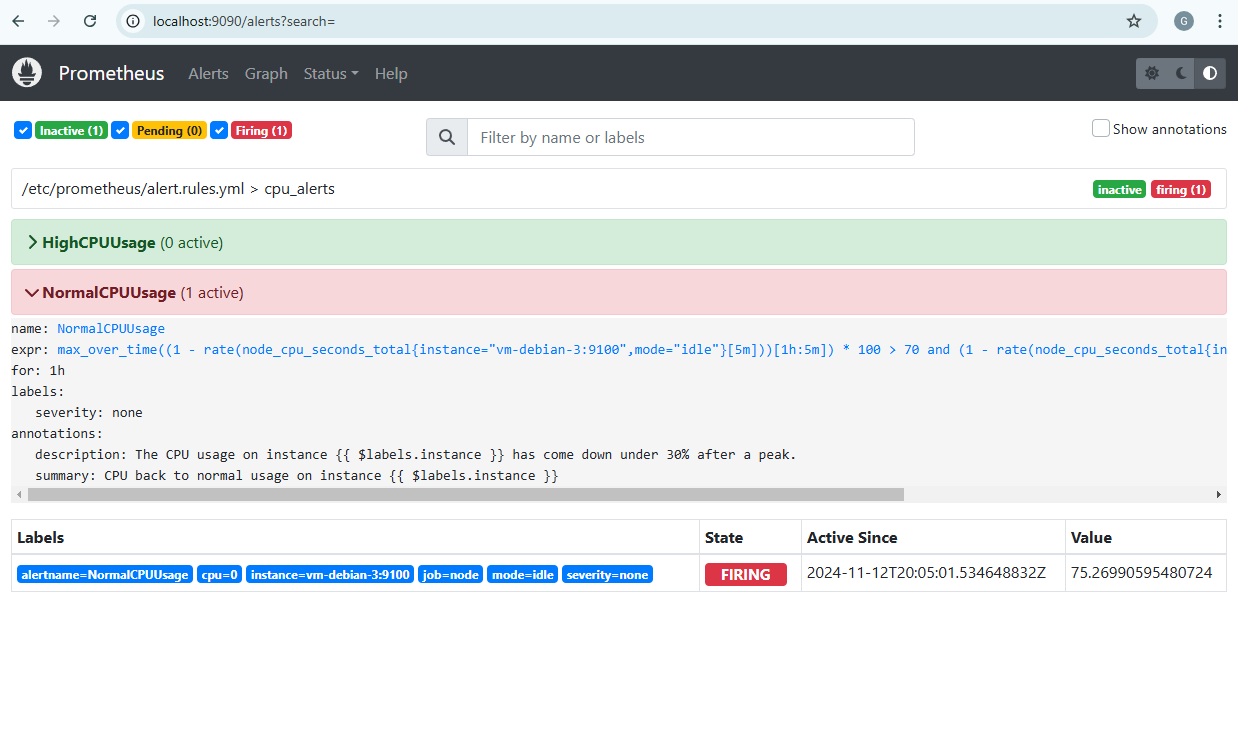
As before, the alert is received on the Alertmanager side and results in a call to the Azure Functions API to delete the VM created on Azure (endpoint delete-vm).
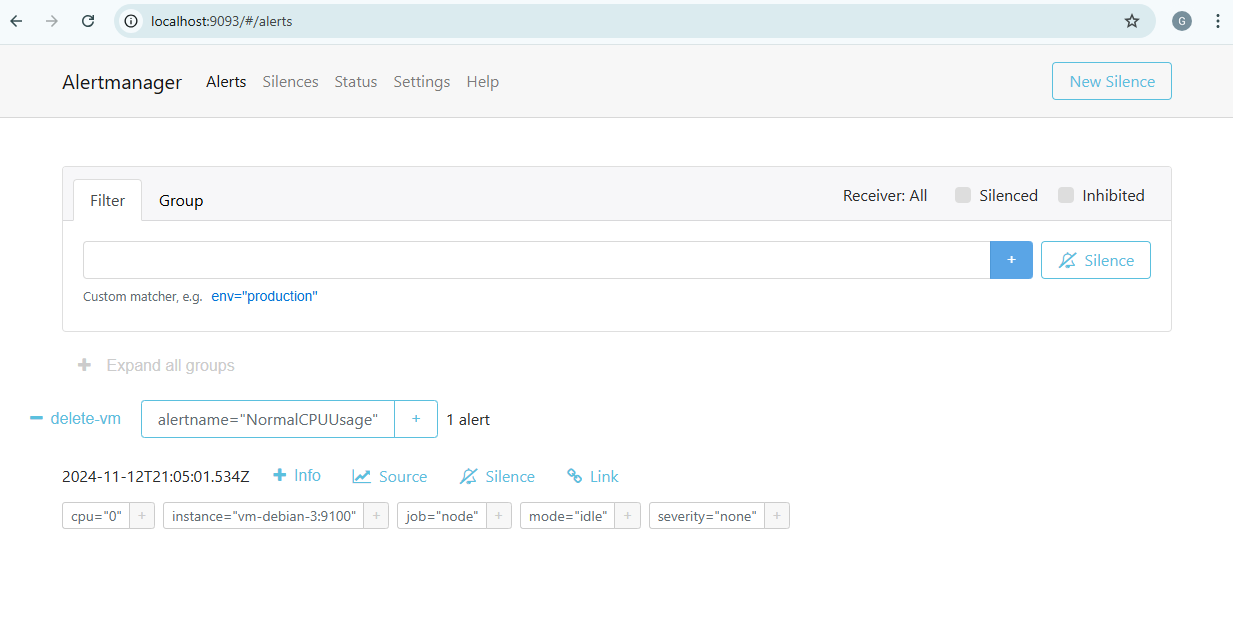
2024-07-18 12:13:01 ts=2024-07-18T10:13:01.283Z caller=dispatch.go:164 level=debug component=dispatcher msg="Received alert" alert=NormalCPUUsage[ccec9d5][active]
2024-07-18 12:13:01 ts=2024-07-18T10:13:01.286Z caller=dispatch.go:516 level=debug component=dispatcher aggrGroup="{}/{alertname=\"NormalCPUUsage\"}:{alertname=\"NormalCPUUsage\"}" msg=flushing alerts=[NormalCPUUsage[ccec9d5][active]]
2024-07-18 12:13:09 ts=2024-07-18T10:13:09.298Z caller=notify.go:848 level=warn component=dispatcher receiver=delete-vm integration=webhook[0] aggrGroup="{}/{alertname=\"NormalCPUUsage\"}:{alertname=\"NormalCPUUsage\"}" msg="Notify attempt failed, will retry later" attempts=1 err="Post \"<redacted>\": dial tcp: lookup tp-cloud-autoscale-vpn.azurewebsites.net on 127.0.0.11:53: server misbehaving"
2024-07-18 12:14:35 ts=2024-07-18T10:14:35.741Z caller=notify.go:860 level=info component=dispatcher receiver=delete-vm integration=webhook[0] aggrGroup="{}/{alertname=\"NormalCPUUsage\"}:{alertname=\"NormalCPUUsage\"}" msg="Notify success" attempts=2 duration=1m26.446343094s
